About the IQM Demonstrator
Independent Quality Monitoring (IQM) can be used to assure trust in digital assets with respect to data, process and product.
This demonstrator shows how sensor signals can be verified according to ISO 8000:210 - Sensor data: Data quality characteristics.
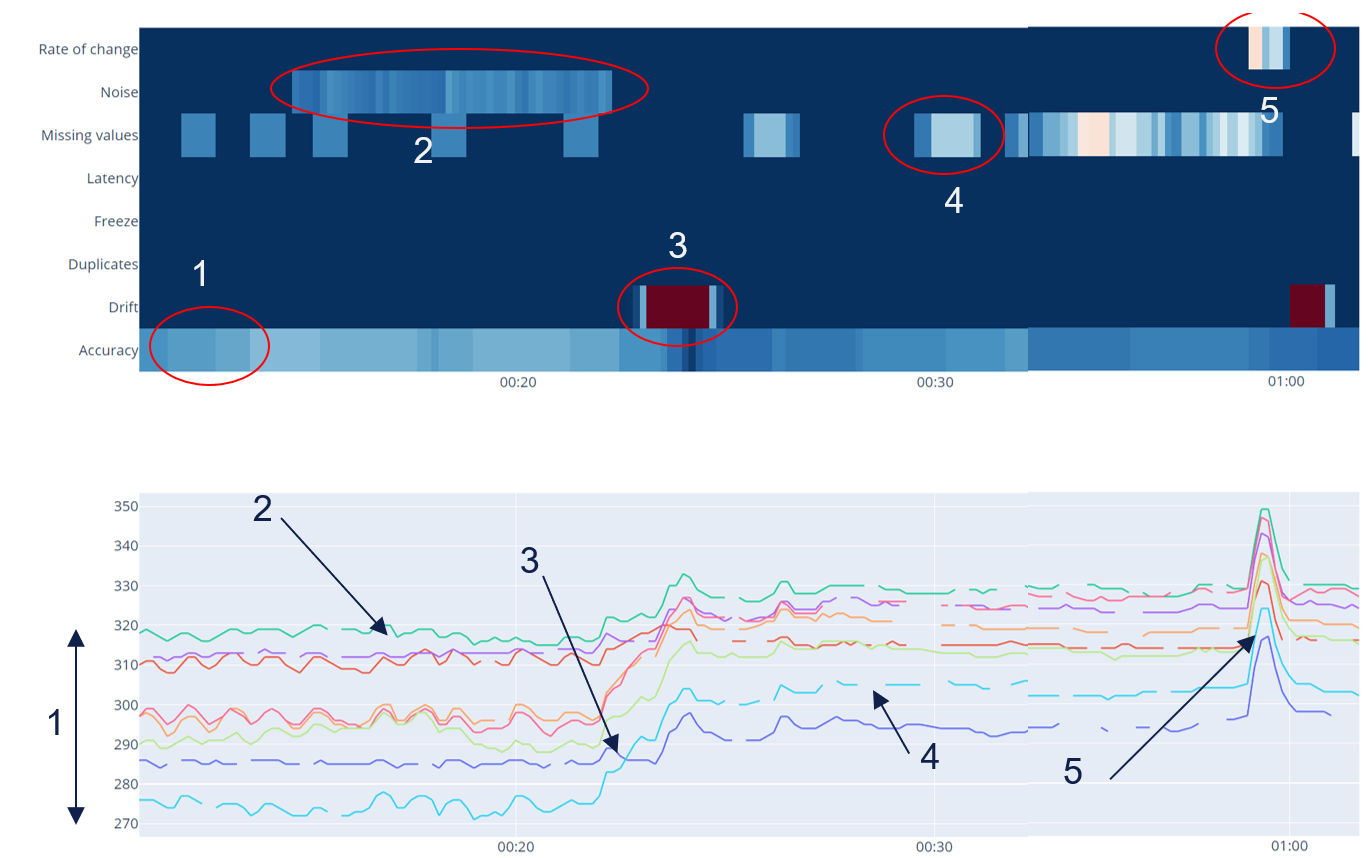
Sample data for 8 sensors measuring exhaust gas temperature is used to evaluate the signal data quality characteristics: drift, noise, accuracy, completeness, rate-of-change, latency, freeze and duplicates.
The below figure shows both the raw data (bottom figure) and the evaluation result (top figure).
IQM provides an
API
for evaluation of quality metrics and the demonstrator dashboard shows one possible use-case for quality monitoring and assurance.
The result from the API can also be used to issue certificates, compliance statements and user notifications.
The anomalies and possible corrective actions to improve data quality and also ensure trust in the digital assets are shown in the below lists numbered according to the anomalies.
Press "Try me" to run demo live or upload your own data to see how it measures up to the same data quality characteristics.
|
Dashboard

|
Data quality anomalies
- Inaccurate data, all sensors measure the same parameter and the gap from high to low represent inaccuracy
- Noise, at low loads the signals show noise pattern
- Drift, when load increases the difference varies, indicating that the sensors are drifting
- Missing data according to expected signal frequency
- Signal rate of change exceeds what is physically possible
Corrective actions
- Calibrate sensors and check that they are mounted correctly and are in the correct position
- Apply noise reduction filter or use sensors with less noise
- Calibrate sensors or replace if necessary
- Check clock synchronisation, adjust frequency or interpolate values
- Investigate if there are external factors causing the sudden peak, remove data
Data format (csv)
IQM is used programatically by the API but the demonstrator can read the below csv format:
- Time, Value1, Value2, Value3
- 2024-03-10 00:11:00,286,310,318
- 2024-03-10 00:11:10,286,311,319
- 2024-03-10 00:11:20,285,311,318
|


